Finance and governanceAnalytics

Cross-app dashboards, governed metrics, alerts, budgets and cash forecasts, with each person’s access respected.

Analytics brings figures from every Thoshika app into one set of defined metrics, from revenue and cash runway to attrition, pipeline and utilisation. Leaders get ready-made dashboards for their role, analysts explore and build their own, and alerts flag thresholds and unusual movements. Planning adds driver-based budgets, rolling forecasts and a cash forecast, and pushes approved budgets into Books.

Key capabilities

  • Catalogue of certified cross-app metrics
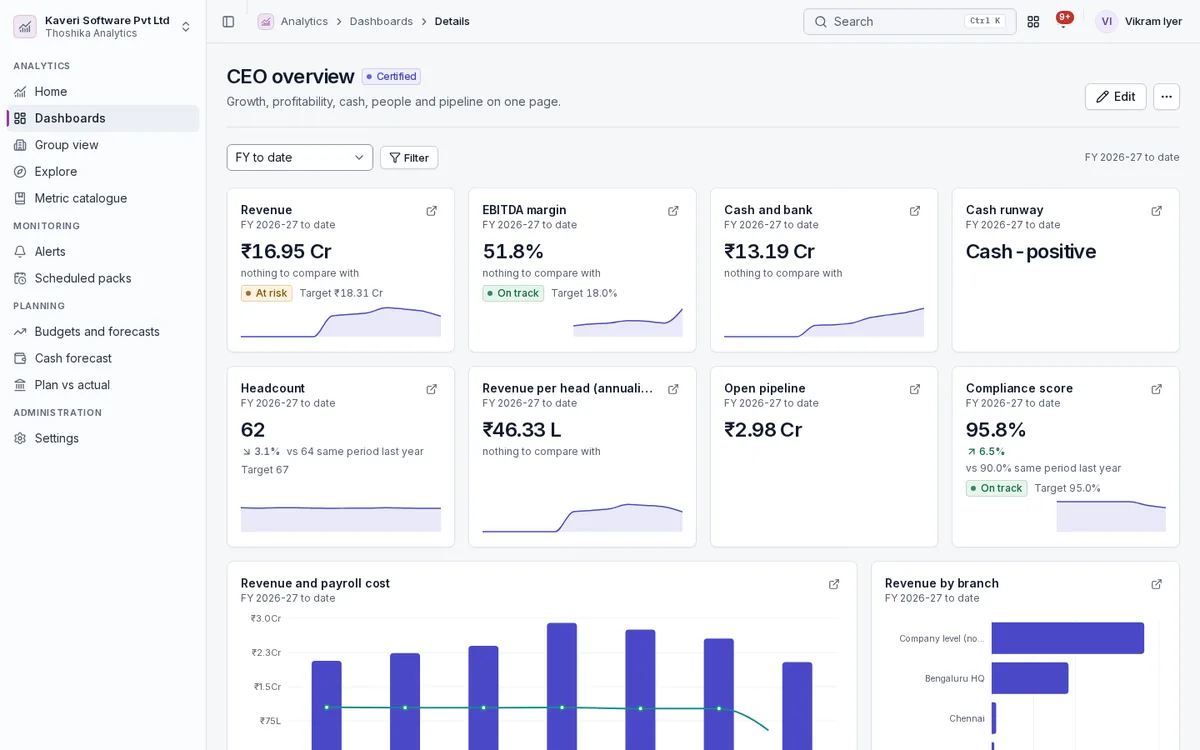
  • Role packs for CEO, CFO, CHRO and more
  • Dashboard builder with drill-down
  • Threshold and anomaly alerts
  • Driver-based budgets and rolling forecasts
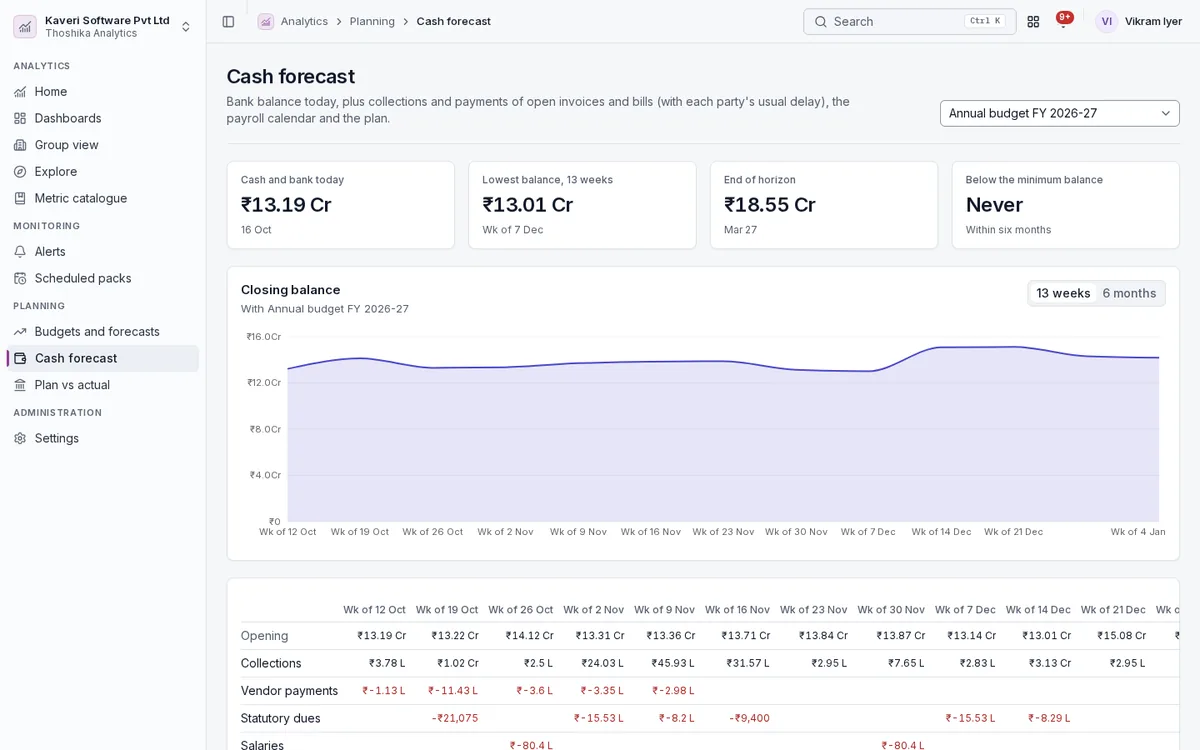
  • 13-week and 6-month cash forecast

Home

A starting page with the figures and alerts that matter to each person.

  • KPI strip for the person’s role
  • My alerts and pinned dashboards
  • Each figure limited to the data the person may see in the source app

Dashboards and role packs

Ready-made dashboards for each leadership role, and a builder for the rest.

  • Certified packs for CEO, CFO, CHRO, sales head, delivery head and COO
  • KPI, target, line, area, bar, pie, table, pivot, gauge and funnel tiles
  • 12-column grid with drag to reorder and resize
  • Dashboard filters for period, branch, legal entity, team and project
  • Drill down one level at a time, and open the source records in the owning app
  • Private dashboards, or shared with roles and people

Group view

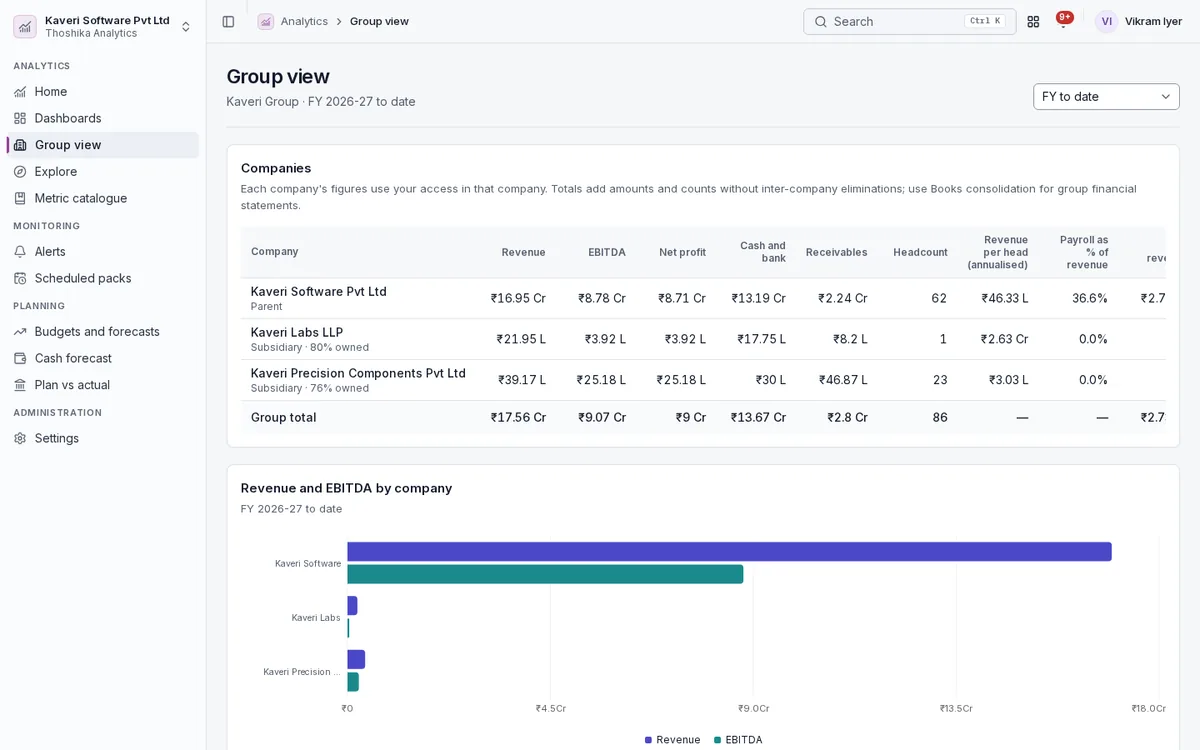
The same KPIs for every company in a group, side by side with a group total.

  • Revenue, EBITDA, net profit, cash, receivables and headcount per company
  • Each company’s figures computed with the viewer’s access there
  • Companies without access clearly marked

Explore and ask a question

Ad-hoc analysis over the metric catalogue, without writing queries.

  • Metric, group by, filters and comparison with the previous period
  • Table, chart and two-dimension pivot
  • Typed questions such as “revenue by month this year” turned into a structured query
  • CSV and Excel export, saved questions and pin to a dashboard
  • Trend projection on time-series charts

Metric catalogue

Every figure has one definition, source and set of dimensions, shared by every dashboard.

  • Finance, people, sales, delivery, support, procurement, manufacturing and compliance metrics
  • Definition, formula, unit, direction and drill path for each
  • Custom metrics as formulas over certified metrics
  • Targets by month, quarter or year with on-track colouring
  • Data domains that decide which roles see which figures

Alerts and scheduled packs

Analytics tells people when something moves, and sends packs on a schedule.

  • Threshold alerts on any metric and grain
  • Anomaly alerts from z-scores or a seasonal baseline
  • Notifications in the app, by email and in a Sangam channel
  • Dashboard packs as PDF or Excel, daily, weekly or monthly
  • Each recipient gets figures for their own access
  • Paginated, pixel-exact report layouts

Budgets and forecasts

Driver-based plans built from the company’s own people and ledger data.

  • Budget, forecast and scenario versions with lineage
  • Revenue drivers such as consultants × utilisation × rate, or logos × ARPU
  • Headcount from People positions and salary cost per cost centre
  • Opex by cost centre: flat, growth, per head or percentage of revenue
  • What-if scenarios compared side by side, and rolling reforecasts
  • Approval by finance and the CEO, then the budget pushed into Books
  • Allocation rules for shared costs, and an Excel add-in for planning

Cash forecast and plan against actual

Where cash is heading over the next quarter and half-year, and how the plan is tracking.

  • 13-week and 6-month cash forecast from the bank balance today
  • Collections and payments from open invoices and bills, using each party’s usual delay
  • Payroll and statutory dues on their calendar, plus capex, loans and tax
  • Lowest balance, closing balance and runway
  • Plan against actual by month, account and cost centre from the Books ledger

Administration

Engine, sync and access settings for the analytics admin.
  • Sync status per data table, refreshed within seconds of a change
  • Data domain access by role
  • Signed, expiring embed links for intranet pages, only for signed-in members
  • Usage log of views, exports and scheduled runs
Screens

Analytics in the product

India

Indian rules, built in

Figures follow Indian reporting conventions out of the box.

How Thoshika handles Indian compliance

  • April to March financial year, with Q1 as April to June
  • Rupees with lakh and crore formatting
  • Revenue from operations as in the Schedule III P&L
  • PF, ESI, TDS and professional tax due dates in the cash forecast
  • Compliance score from MCA filings and labour-law obligations
  • GSTIN and branch scopes carried into every query
Mobile

Analytics on Android and iOS

Analytics is in the Thoshika app for anyone who can open it.

About the mobile apps

On the phone

  • KPI home for the person’s role
  • Dashboards, read-only
  • Alerts with acknowledge
Who uses it

Roles in Analytics

Every person signs in once. Roles decide what they see, and can be limited to a location, branch or other scope where the app supports it.

Leader

Reads role dashboards and the group view, and receives alerts and scheduled packs.

Analyst

Explores metrics, builds dashboards and sets up alerts and schedules.

Planner

Builds budgets, scenarios and forecasts, and submits them for approval.

Analytics admin

Manages settings, sync, data domain access, custom metrics, targets and embed links.

See Analytics with your own processes

Analytics is available on its own or as part of Thoshika One, with every app for every employee.